Looking at white papers, data sheets and articles about narrowband PLC, I get confused about the data rates mentioned in materials. It seems rather challenging to compare various technologies. With this blog I would like to bring some light into this topic.
A typical bit rate example:
The example below is taken from a chip supplier presentation that is available on the internet.
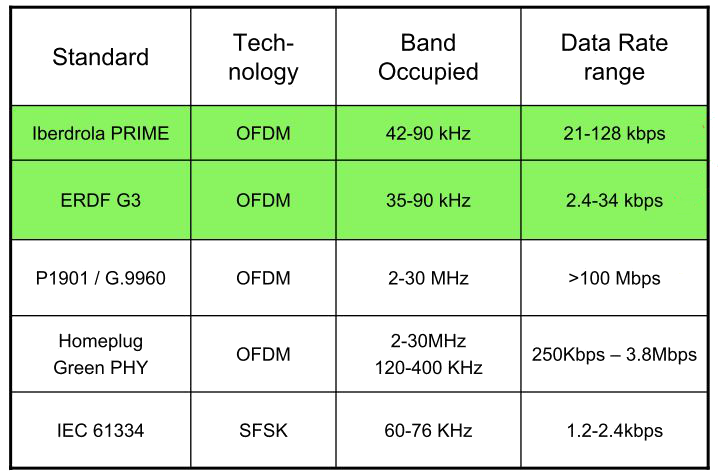
The table reflects a common perception of various communications technologies. Some quite typical conclusions would be:
- PRIME is superior in terms of throughput compared to G3-PLC G3
- P1901.2 is superior to G3 as well. However, the physical layer is identical, so how is this possible?
Neither of the statements is correct. Looking at the theoretical maximum raw bit rate on the physical layer, we see that all three are more or less equal to each other. The differences appear on upper layers where it’s no longer possible to compare technologies one-to-one; except under well-defined conditions.
What do the different “rates” mean?
Another factor that causes trouble in reading and understanding the figures is the varying terminology used for rates. provides the following terms and explanations:
|
Term |
Alternative terms |
Explanation |
|
Gross bit rate |
- Raw bit rate |
…is the total number of physically transferred bits per second over a communication link, including useful data as well as protocol overhead |
|
Information rate |
- net bit rate |
…is the capacity excluding the physical layer protocol overhead, for example time division multiplex (TDM) framing bits, redundant forward error correction (FEC) codes, equalizer training symbols and other channel coding. The physical layer net bit rate is the data rate measured at a reference point in the interface between the datalink layer and physical layer, and may consequently include data link and higher layer overhead. |
|
Network throughput |
…is essentially the same thing as digital bandwidth consumption. It denotes the achieved average useful bit rate in a computer network over a logical or physical communication link or through a network node, typically measured at a reference point above the datalink layer. |
|
|
Goodput |
- data transfer rate |
…refers to the achieved average net bit rate that is delivered to the application layer, exclusive of all protocol overhead, data packets retransmissions, etc. |
What are the raw bit rates of today’s NB PLC technologies?
For this comparison, the bit rate is simply calculated as

Where BPSK is 1 bit, QPSK is 2 bits and 8PSK 3 bits per subcarrier.
The table below shows the result for the Cenelec A band (5-95kHz).
|
Technology |
Carriers |
Symbol duration |
BPSK kbps |
QPSK kbps |
8PSK kbps |
|
G3-PLC (ITU-T G.9903) |
36 |
695µs |
51.8 |
103.6 |
155.4 |
|
IEEE 1901.2 |
36 |
695µs |
51.8 |
103.6 |
155.4 |
|
PRIME r1.4 |
96 (+1)*) |
2,240µs |
42.85 (43.3) |
85.7 (86.6) |
128.6 (129.9) |
*) PRIME uses one carrier as pilot.
The table shows that actually all these technologies are more or less equal. This is not a surprise for G3 and IEEE 1901.2, as they have the same physical layer specification. However, surprisingly the raw bit rate of PRIME is slightly lower than G3. Looking into the theory of OFDM, an explanation can be found.
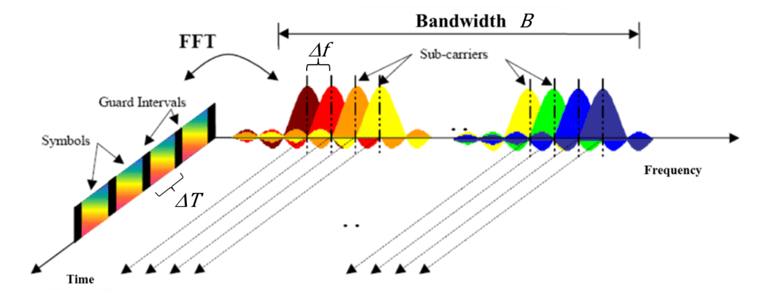
Theory of OFDM
The raw bit rate for all OFDM-based technologies is theoretically equal when the spectrum used is equal and the same modulation is used. This is because OFDM means that the symbol duration and the carrier spacing have the following relation 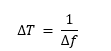
If all OFDM technologies use the same spectrum and the same modulation then the calculation is as follows:
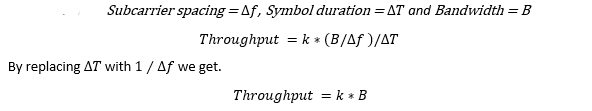
The raw bit rate is proportional to the bandwidth only. More subcarriers do not mean higher speed. As we can see, PRIME uses 96 subcarriers with a bandwidth (spectrum) of 46.875 KHz, whereas G3 and IEEE 1901.2 use 36 subcarriers with a bandwidth of 54.6875 kHz. This explains the lower raw bit rate of PRIME.

What about the “real” throughput on the application layer?
The communication is semi-duplex on a shared medium and hence the capacity per communication relation is a fraction of the maximum capacity. When looking at a single communication relation (= up- and downstream-route), it becomes obvious that the throughput on a route must be divided by the number of links. If a route has one intermediate hop, which equals 2 links, the throughput is half of the maximum, if there are 3 links it’s one third and so on. In existing networks we see an average of 2.5 links. Additionally, the semi-duplex behavior halves the throughput. All in all, this ends up in a division by 5 for the maximum raw bit rate in real networks. Additionally, we see the average speed in real networks to be around the speed of DBPSK, which means 1 bit per carrier instead of the 3 bits for D8PSK. This is another division by 3. At this stage we end up at 155kbps/15 = ~10kbps for all OFDM technologies in the Cenelec A band.
So far we have been talking about the raw speed on the physical level only. In addition to this preamble, forward error correction (FEC), padding, headers on each layer, MAC layer mechanisms like tone map, CSMA or beacon, and management traffic absorb additional capacity.
Robustness is the key to speed on the application layer
One of the most important factors for throughput on the application layer is the robustness of the technology. Power lines can be compared with a gravel road. If you drive on this gravel road with a F1 car you will miss traction. If you use a rally car which is slower on paper, you will be faster on the gravel road. On a paved road (lab conditions) it’s the opposite. The same applies to PLC: if the technology is not able to deal efficiently with the noise (gravel), the throughput will not be good even though the raw bit rate (=engine power) looks good.
The robustness of a PLC technology is built in the forward error correction (FEC), on mac layer mechanisms and in the routing. All these aspects are addressed differently in the different technologies. Here is a comparison of these aspects.
|
Mechanism |
G3-PLC ITU-T G.9903 |
IEEE 1901.2 |
PRIME r1.4 |
|
|
Modulation |
Dynamic |
Per link |
Per link |
Per switch (route) |
|
FEC |
Convolutional encoder |
1/2 |
1/2 |
½ |
|
Scrambler |
yes |
yes |
yes |
|
|
Interleaver |
yes |
yes |
yes |
|
|
Robust mode |
Repeater (4x, 6x) |
Repeater (4x, 6x) |
Repeater (4x) *) |
|
|
Reed Solomon |
yes |
yes |
no |
|
|
MAC-Layer |
Beacon-based |
no |
no |
yes |
|
|
CSMA-CA |
yes |
yes |
no |
|
|
Tone map |
Per link |
Per link |
none |
|
Routing |
LOADng (on MAC layer) tailored to PLC |
RPL on IP layer |
proprietary |
|
Real throughput on the application layer (Goodput)
There is very little information available about the throughput on the application layer in real networks. A fair comparison can only be done when the different technologies are run on the same network. Even though Landis+Gyr has experience with PLAN, PRIME (r1.3) and G3, we do not have data of the behavior of these technologies in the same network. What we can say is that OFDM is definitely a giant leap forward from the former S-FSK-based technologies like PLAN. Where the legacy PLC technologies deliver some 100 bps, the new technology can reach around some kbps on the application layer. This offers enough throughput for today’s smart meter use cases and has head room for future use cases as well.